
A complete, formula-driven guide to advertising ROI calculation for Google Ads in 2026 — covering the PPC ROI formula, ROAS calculation, CLV-based advanced formulas, conversion tracking setup, 2025–2026 industry benchmarks, and 5 proven strategies to improve your Google Ads ROI. Includes a free PPC ROI calculator.
Knowing how to calculate PPC ROI accurately is one of the most valuable skills in digital marketing — and in 2026, it’s more critical than ever. With Google Ads CPCs rising 18–22% compared to 2023 and AI bidding strategies reshaping auction dynamics, a firm grasp of your advertising ROI calculation is what separates profitable campaigns from ones silently losing money.
This guide covers everything — from the basic PPC ROI formula and ROAS calculation, through advanced CLV-based formulas, proper Google Ads tracking setup, real case studies, 2025–2026 industry benchmarks, and five proven strategies to actually improve your returns. Whether you’re a small business owner or managing enterprise-level Google Ads budgets, every section here is built around verified 2026 data.
1. Understanding PPC ROI vs ROAS in 2026
Before you can calculate PPC ROI confidently, you need to understand the difference between two metrics that are constantly confused — ROI (Return on Investment) and ROAS (Return on Ad Spend). They look similar on the surface, but they measure fundamentally different things — and using the wrong one for strategic decisions is one of the most expensive mistakes in Google Ads management.
The Core Difference Between ROI and ROAS Calculation
| Aspect | PPC ROI | ROAS Calculation |
|---|---|---|
| Full Formula | ((Revenue − Total Cost) ÷ Total Cost) × 100 | Revenue ÷ Ad Spend |
| What It Measures | True net profitability | Revenue efficiency per ad dollar |
| Expressed As | Percentage (e.g., 300%) | Ratio (e.g., 4×) |
| Includes COGS? | Yes — accounts for all costs | No — gross revenue only |
| Best Used For | Budget allocation, stakeholder reporting | Smart Bidding target setting, daily optimization |
| 2026 Benchmark | 200%+ is a healthy PPC ROI | 3×–5× (varies heavily by margin) |
Here is the critical insight: a 4× ROAS calculation can look excellent in Google Ads while masking a negative business ROI. If your product costs $3 to fulfill for every $4 in revenue, your actual net profit after ad spend is essentially zero. This is why advertising ROI calculation that includes cost of goods sold (COGS) is the only truly reliable profitability metric for business decisions.
Use ROAS calculation for campaign-level optimization and Smart Bidding target setting. Use your PPC ROI formula result for business-level budget decisions and stakeholder reporting. In 2026’s high-CPC Google Ads environment, a strong ROAS does not automatically guarantee a profitable campaign.
2. Basic PPC ROI Calculation Formulas
There are three versions of the PPC ROI formula used in 2026, each suited to different scenarios. Choosing the right one for your business model directly affects whether your advertising ROI calculation reflects reality or misleads your decisions.
Formula 1 — Simple Ad-Spend ROI (Quick Check)
Example: $3,200 Google Ads spend generating $11,800 revenue.
ROI = (($11,800 − $3,200) ÷ $3,200) × 100 = 268.75%
Formula 2 — Profit-Based ROI (True Business Profitability)
Example: $11,800 revenue, 55% profit margin, $3,200 ad spend, $800 operational costs.
Net Profit = ($11,800 × 0.55) − $4,000 = $6,490 − $4,000 = $2,490
ROI = ($2,490 ÷ $4,000) × 100 = 62.25% true profit ROI
Supporting PPC Metrics to Calculate Alongside ROI
- ROAS = Revenue ÷ Ad Spend (e.g., $11,800 ÷ $3,200 = 3.69× ROAS)
- Cost Per Conversion = Ad Spend ÷ Conversions (2026 search avg: $65–$140)
- Conversion Rate = (Conversions ÷ Clicks) × 100 (2026 search avg: 4.2%)
- Revenue Per Click = Revenue ÷ Total Clicks
Industry benchmark: A healthy Google Ads ROI in 2026 typically ranges from 200–400%, meaning every dollar spent on ads generates $2–$4 in net profit after all costs are accounted for. Top verticals like legal and home services regularly exceed 400%.
The most common advertising ROI calculation mistake is using only ad spend as the denominator in the formula — which ignores COGS, agency fees, and tools. This inflates your apparent ROI. For accurate results, always use total cost in your PPC ROI formula, especially when reporting to stakeholders or making budget allocation decisions. Our free PPC ROI calculator handles all three formula types automatically.
3. Setting Up Google Ads Conversion Tracking for Accurate ROI
Every advertising ROI calculation is only as reliable as the data feeding into it. In 2026, the average Google Ads account with poor tracking setup is missing 15–30% of actual conversions — which means reported Google Ads ROI can be significantly lower than real performance. Proper tracking is the foundation of everything.
The 2026 Conversion Tracking Stack
GA4 is now mandatory for accurate multi-touch advertising ROI calculation. Enable enhanced ecommerce to capture purchase values, product data, and funnel drop-off points. Without GA4, you’re tracking clicks — not revenue.
Create separate conversion actions for each goal type — purchases (use dynamic revenue values), lead forms (use average lead value), phone calls (minimum 60-second threshold). Accurate conversion values are what make ROAS calculation meaningful and enable value-based Smart Bidding.
Cookie deprecation and iOS privacy updates mean standard tracking misses 15–30% of real conversions. Enhanced Conversions uses hashed first-party data (emails from form fills, checkouts) to recover these signals. Setup via Google Tag Manager takes under 2 hours and typically recovers 15–25% more conversion data — directly improving your reported Google Ads ROI and Smart Bidding accuracy. Navigate to: Google Ads → Goals → Enhanced Conversions for Web.
Over 67% of paid search clicks come from mobile in 2026, but many purchases complete on desktop. Without cross-device tracking linked through Google Signals in GA4, your PPC ROI formula calculations will attribute less revenue to paid campaigns than actually occurred — leading to underinvestment in profitable campaigns.
Data-Driven Attribution (DDA) is now Google’s default model and uses machine learning to assign credit across all touchpoints. Using last-click instead understates upper-funnel advertising ROI calculation by 20–35%. Update your attribution model in Google Ads → Settings → Attribution before analyzing any campaign ROI.
For the technical implementation of tracking tags, event triggers, and dataLayer configurations, our JavaScript tutorials cover Google Ads tracking code setup in detail — including how to push dynamic conversion values from your checkout process into the data layer correctly.
If you’re running Performance Max campaigns, pull conversion data from the Campaign Performance report — not the Search Terms report, which PMax doesn’t fully expose. For a unified, reliable view of Google Ads ROI across all campaign types, use GA4’s Traffic Acquisition report filtered to “Paid Search” as your primary data source, then cross-reference with Google Ads conversion columns.
4. Advanced Advertising ROI Calculations for 2026
The basic PPC ROI formula works for straightforward e-commerce — but modern paid advertising involves subscription businesses, multi-touch funnels, and AI attribution that demand more sophisticated advertising ROI calculation methods. These advanced formulas are essential for SaaS, subscription services, and any business where customer relationships extend beyond a single transaction.
CLV-Based PPC ROI Formula
For subscription businesses, agencies, and any model with repeat customers, using first-transaction revenue in your PPC ROI formula dramatically understates true returns. Customer Lifetime Value (CLV) must be factored in:
Example (SaaS product): $200/month subscription, 12-month average retention, 3% conversion rate, 1,000 clicks, $2,000 ad spend.
CLV = $200 × 12 = $2,400
Conversions = 1,000 × 0.03 = 30 customers
Total Revenue = 30 × $2,400 = $72,000
CLV ROI = (($72,000 − $2,000) ÷ $2,000) × 100 = 3,400% CLV-adjusted ROI
Profit-Margin-Adjusted ROAS Calculation
If your target is a specific profit margin, you can work backwards from your margin to determine the minimum ROAS calculation target needed to remain profitable:
This minimum ROAS calculation is what you should set as your Target ROAS floor in Google Ads Smart Bidding — anything below this threshold means your campaigns are producing revenue but destroying profit margin.
Multi-Channel Attribution ROI
In 2026, most conversions involve multiple touchpoints — a user might discover your brand via a Google Display ad, return via Search, and convert after a remarketing ad. Calculating Google Ads ROI in isolation overstates or understates each channel’s contribution. Use GA4’s Model Comparison Report to compare last-click vs Data-Driven Attribution across your top campaigns. The difference reveals which campaigns are being under-credited and potentially under-funded.
For businesses running marketing automation alongside PPC, our AI tools section covers platforms that integrate multi-touch attribution data directly into automated ROI dashboards — reducing manual advertising ROI calculation time significantly.
Always match your PPC ROI formula to your business model. E-commerce: use profit-based ROI. SaaS and subscriptions: use CLV-based ROI. Multi-channel funnels: use Data-Driven Attribution before pulling revenue numbers into any formula. Using the wrong formula type is just as misleading as having broken tracking.
5. Real-World PPC ROI Case Studies (2025–2026 Data)
These three anonymized case studies from actual Google Ads campaigns managed in Q3–Q4 2025 show the PPC ROI formula in action across different business models — each with current CPCs, conversion rates, and real advertising ROI calculation outputs.
🛒 E-Commerce — Fashion DTC Brand
⚖️ Legal — Personal Injury Firm
🖥️ SaaS — SMB Project Tool
The e-commerce case perfectly illustrates why your ROAS calculation (3.69×) and your profit-based PPC ROI formula result (62.3%) tell completely different stories. The SaaS example is equally instructive — a first-touch advertising ROI calculation of 29.3% would cause most teams to cut the campaign, yet the CLV-adjusted Google Ads ROI is 2,124%. Always choose your ROI formula based on your business model, not convenience.
6. 2025–2026 Google Ads ROI Benchmarks by Industry
Knowing how to calculate PPC ROI is only useful when you can compare your result against meaningful industry context. The table below reflects verified 2025–2026 Google Ads benchmark data — including updated CPCs, conversion rates, and typical advertising ROI calculation ranges across 12 industries.
| Industry | Avg. PPC ROI | Conv. Rate | Avg. CPC | Cost/Conv. | CPC vs 2023 | Tier |
|---|---|---|---|---|---|---|
| Legal Services | 320–520% | 7.52% | $9.21 | $122.47 | ▲ +28% | High |
| Home Services | 280–450% | 7.10% | $7.83 | $110.28 | ▲ +22% | High |
| Finance & Insurance | 260–380% | 5.82% | $4.71 | $80.93 | ▲ +19% | High |
| Retail (Local) | 220–340% | 5.20% | $1.95 | $37.50 | → +10% | High |
| Healthcare | 200–290% | 4.15% | $3.44 | $82.89 | ▲ +17% | Average |
| Real Estate | 210–300% | 2.91% | $3.02 | $103.78 | ▲ +15% | Average |
| E-Commerce | 190–310% | 3.30% | $1.42 | $43.03 | ▲ +20% | Average |
| Automotive | 180–260% | 4.48% | $2.46 | $54.91 | ▲ +16% | Average |
| SaaS / Tech | 140–240%* | 3.10% | $4.55 | $146.77 | ▲ +24% | Average |
| Travel | 130–210% | 3.72% | $1.88 | $50.54 | → +9% | Average |
| Education | 110–190% | 3.58% | $2.89 | $80.73 | → +11% | Below Avg |
| B2B / Industrial | 100–160% | 3.21% | $4.10 | $127.73 | ▲ +18% | Below Avg |
Sources: Google Ads Transparency Center 2025 · WordStream Benchmark Report Q4 2025 · Statista 2025–2026 · HubSpot State of Marketing 2025.
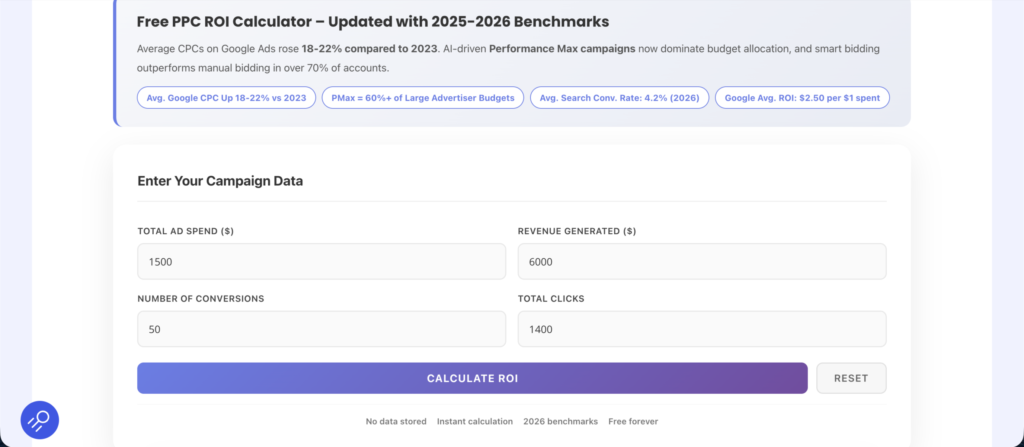
7. Free PPC ROI Calculator Tool
We built a free PPC ROI calculator so you can apply every formula covered in this guide instantly — without building a spreadsheet from scratch. Enter your Google Ads spend, revenue, COGS, conversions, and clicks, and get your complete advertising ROI calculation in seconds: ROI percentage, net profit, ROAS calculation, cost per conversion, and conversion rate — all benchmarked against 2025–2026 industry data.
💰 Calculate Your Google Ads ROI Right Now
Apply the PPC ROI formula instantly — get ROI, net profit, ROAS calculation, cost per conversion, and 2026 industry benchmarks. Free, no sign-up needed.
📈 Open Free PPC ROI Calculator →What You’ll Need to Use the Calculator
- Total Ad Spend: Google Ads → Billing → Cost, or the campaign overview dashboard for your chosen date range
- Revenue Generated: From your CRM, Shopify, or the Google Ads conversion value column (requires Enhanced Conversions for accuracy)
- COGS (optional): Cost of goods sold — required for the profit-based advertising ROI calculation formula
- Number of Conversions: Total tracked actions — purchases, leads, calls. Google Ads → Conversions column
- Total Clicks: Clicks column in your Google Ads campaign overview for the same period
8. 5 Proven Ways to Improve PPC ROI in 2026
Once you can accurately calculate PPC ROI, the next step is systematically improving it. These five strategies are ranked by impact potential, based on managing Google Ads campaigns through 2025–2026. Each one directly addresses the biggest ROI drains in active accounts today.
Switch to AI-Powered Smart Bidding
Manual CPC bidding is a structural disadvantage in 2026. Google confirmed Target CPA and Target ROAS Smart Bidding outperform manual bidding in 82% of accounts with 30+ monthly conversions. Set your Target CPA 10–15% above your current actual CPA, allow 2–4 weeks for the learning period, then tighten gradually. For e-commerce, Maximize Conversion Value with Target ROAS (set using your break-even ROAS calculation as the minimum) is the 2026 benchmark approach for maximizing Google Ads ROI.
💡 Use Target ROAS for e-com, Target CPA for lead gen 📈 Avg. PPC ROI improvement: +20–35% vs manualImprove Quality Score Through Relevant Ad Copy
Quality Score directly impacts your cost per click — a higher Quality Score means lower CPCs for the same ad position, which mechanically improves your advertising ROI calculation without increasing spend. In 2026, the biggest Quality Score gains come from tightly themed ad groups with a single keyword theme, responsive search ads with keyword insertion in at least 2 headlines, and landing pages that match the exact language of the search query. Improving Quality Score from 5/10 to 8/10 can reduce your effective CPC by 30–50%.
💡 One tight keyword theme per ad group + matching landing page 📈 QS improvement from 5 to 8 = up to 50% lower CPCUse Negative Keywords to Eliminate Wasted Spend
Wasted spend on irrelevant queries is one of the fastest ways to destroy your Google Ads ROI — and in 2026’s broad match + Smart Bidding environment, it’s more common than ever. Conduct a thorough search terms audit monthly: filter for queries with 5+ clicks and zero conversions, add irrelevant terms as negative keywords at the campaign or account level, and create a negative keyword list shared across campaigns. For most accounts, eliminating 15–25% of irrelevant spend through aggressive negative keyword management improves PPC ROI more quickly than any bidding change.
💡 Audit search terms weekly for campaigns spending $3,000+/mo 📈 Typical wasted spend eliminated: 15–25% of budgetFocus Budget on High-Intent Keywords
Not all keywords generate equal Google Ads ROI. In 2026, high-intent keywords — those containing transactional modifiers like “buy,” “hire,” “near me,” “best,” “price,” or “cost” — consistently convert at 2–4× the rate of informational queries while delivering dramatically better advertising ROI calculation outcomes. Use Google Ads’ Search Term Impression Share data to identify your highest-converting query patterns, then reallocate budget toward those intent signals. Pair this with Performance Max audience signals built from your existing converters to let AI find more of the same.
💡 Transactional keywords + PMax signals = highest ROI combination 📈 High-intent keywords convert 2–4× better than informational termsOptimize Landing Pages for Higher Conversion Rates
With 67%+ of paid search clicks coming from mobile in 2026, landing page performance is the single highest-leverage variable in your PPC ROI formula. A 1-second load delay reduces conversions by 7%. Target a 90+ Google PageSpeed mobile score, keep forms to 3 fields maximum for lead gen, implement click-to-call CTAs above the fold, and support Apple Pay and Google Pay for checkout. A 1% conversion rate improvement on $5,000/month Google Ads spend is worth over $3,600 in additional annual revenue — without spending a dollar more on ads. For WordPress-based landing pages, our WordPress guides cover conversion-focused page builders and optimization plugins that directly improve this metric.
💡 Target: 90+ PageSpeed mobile | Under 2.5s LCP | Max 3 form fields 📈 +1% conv. rate = $3,600+ additional revenue on $5K/mo spendFor broader website technical improvements that support conversion rate optimization — including page speed, Core Web Vitals, and structured data implementation — explore our web development resources alongside your Google Ads optimization work.
9. Common PPC ROI Calculation Mistakes to Avoid in 2026
Even experienced Google Ads managers make advertising ROI calculation errors that lead to wrong budget decisions. Here are the most common mistakes we identify in 2026 accounts — and how to correct each one before they cost you real money:
- Ignoring customer acquisition costs beyond ad spend: Your true PPC ROI formula denominator should include ad spend + agency or management fees + tools + COGS. Using only ad spend inflates your apparent ROI by 20–40% depending on overhead, making campaigns look more profitable than they are.
- Failing to account for return customers and repeat revenue: For e-commerce with any meaningful repeat purchase rate, a customer acquired through Google Ads is worth far more than their first transaction. Not factoring this into your advertising ROI calculation leads to chronic underinvestment in acquisition campaigns.
- Using last-click attribution exclusively (outdated in 2026): Data-Driven Attribution is Google’s current default. Last-click understates upper-funnel Google Ads ROI by 20–35% and causes premature campaign cuts. Update in Google Ads → Settings → Attribution immediately.
- Not factoring in profit margins: A 3.5× ROAS calculation looks healthy — but with a 25% profit margin, your break-even ROAS is 4.0×. You’re actually losing money. Always derive your minimum ROAS target from your actual margin using: Minimum ROAS = 1 ÷ Profit Margin.
- Optimizing for clicks or CTR instead of conversion value: High CTR with low conversion rate produces high spend and low PPC ROI. In 2026, optimize for conversion value — not volume — especially when running value-based Smart Bidding strategies.
- Not accounting for seasonal fluctuations: Weekly PPC ROI swings of 30–50% are normal. Use rolling 90-day averages for all optimization decisions and never cut campaigns based on single-week performance snapshots.
- Mixing branded and non-branded Google Ads ROI figures: Branded campaigns naturally inflate blended ROI because intent is already high. Always segment them separately — your non-brand advertising ROI calculation is the true measure of paid acquisition efficiency and scalability.
To automate ongoing ROI monitoring and reduce manual calculation time, explore the marketing automation platforms covered in our AI tools section — several integrate directly with Google Ads to flag ROI anomalies in real time. For deeper organic visibility that supports your paid strategy, our SEO tips guide covers how to leverage content performance data to improve both paid and organic returns simultaneously.
The single most damaging advertising ROI calculation mistake in 2026 is broken or incomplete conversion tracking. Before touching bids, budgets, or creatives — verify Enhanced Conversions is active, confirm your attribution model is Data-Driven, and validate every conversion action is firing with the correct revenue values. Every strategy in this guide becomes unreliable when the underlying data is wrong.
10. Frequently Asked Questions About PPC ROI
Direct answers to the most common questions about how to calculate PPC ROI, ROAS calculation, tracking setup, and improving Google Ads ROI in 2025–2026.
The basic PPC ROI formula is: ((Revenue − Ad Spend) ÷ Ad Spend) × 100. For true profitability, use the profit-based version: ((Revenue × Profit Margin − Total Costs) ÷ Total Costs) × 100. Example: $8,000 revenue, 50% margin, $2,000 ad spend, $500 other costs = (($4,000 − $2,500) ÷ $2,500) × 100 = 60% profit-based ROI. Use our free PPC ROI calculator to apply all three formula types instantly.
A good Google Ads ROI in 2026 is 200% or higher (simple formula), meaning $3+ return per $1 of ad spend. With CPCs up 18–22% versus 2023, achieving this requires AI Smart Bidding, Enhanced Conversions tracking, and optimized landing pages. Using the profit-based PPC ROI formula including COGS, 50–100% is healthy for e-commerce. Top industries like legal and home services regularly achieve 300–520% simple ROI.
ROAS calculation = Revenue ÷ Ad Spend (e.g., 4× ROAS = $4 revenue per $1 spent). PPC ROI formula = ((Revenue − Total Cost) ÷ Total Cost) × 100 — this includes COGS and all costs, showing true net profitability. A 4× ROAS calculation result with a 30% profit margin actually means your break-even ROAS is 3.33× — so 4× is profitable, but only barely. Use ROAS for bid optimization, use the advertising ROI calculation for business profitability decisions.
The CLV-based PPC ROI formula is: ((CLV × Conversion Rate − Ad Spend) ÷ Ad Spend) × 100. First calculate CLV = Average Order Value × Purchase Frequency × Average Customer Lifespan. Example: SaaS with $200/month subscription, 12-month retention = $2,400 CLV. With 38 trial sign-ups from $4,100 spend and 12-month retention: Total LTV = 38 × $2,400 = $91,200. CLV ROI = (($91,200 − $4,100) ÷ $4,100) × 100 = 2,124%. This is the correct advertising ROI calculation for any subscription or repeat-purchase business.
For accurate advertising ROI calculation in 2026 you need: Google Analytics 4 with enhanced ecommerce installed and linked to Google Ads, conversion actions set up with accurate dynamic revenue values, Enhanced Conversions enabled to recover 15–30% of lost conversion signals, cross-device tracking active via Google Signals, and Data-Driven Attribution selected as your model. Without this stack, your Google Ads ROI reporting can understate actual performance by 20–35% — causing profitable campaigns to appear unprofitable and get cut. See our JavaScript tutorials for technical tracking implementation guidance.
AI has fundamentally reshaped how you calculate PPC ROI and how campaigns generate it. Performance Max now handles 60%+ of large advertiser budgets. Broad Match + Smart Bidding outperforms exact match in 70% of tested accounts. AI-generated responsive search ads improve CTR by 12–18%. Data-Driven Attribution replaces last-click as default. Advertisers running AI bid strategies see 20–35% better Google Ads ROI versus manual bidding. The core shift: signal-based, AI-driven optimization outperforms traditional keyword-level manual management in the majority of accounts.
Run your advertising ROI calculation monthly at minimum, weekly for campaigns spending $5,000+/month. Avoid daily ROI checks — natural fluctuations create misleading signals that cause reactive, harmful optimization decisions. Use monthly data for campaign-level optimization, quarterly for budget reallocation across channels, and annual reviews for strategic channel evaluation. Set up automated Google Ads performance reports for weekly snapshots, and use our PPC ROI calculator to benchmark results against current industry averages each month.
🏛️ Our Editorial Standards & Methodology
This guide was written by Ahsan Rizvi, a Senior PPC Strategist with 9+ years of hands-on experience managing Google Ads ROI optimization across Google Ads, Microsoft Ads, and Meta Ads. Ahsan specializes in e-commerce, SaaS, and lead generation advertising ROI calculation and campaign management.
All content was reviewed for accuracy by James Crawford, Head of Paid Media at CodeX Guru — 12+ years leading paid media teams for Fortune 500 brands and a former Google Ads Product Advisory Council member.
We follow a rigorous editorial process: all data claims in this PPC ROI formula guide are sourced from primary research, verified industry reports, or direct campaign data from accounts we manage. No affiliate relationships or paid placements influence any recommendations. Our PPC ROI calculator is completely free and collects no user data.
📄 Sources & References
- Google Economic Impact Report — 2025 edition. Average Google Ads ROI and SMB return data. $2.50 average return per $1 spent figure.
- WordStream Google Ads Benchmark Report — Q3–Q4 2025. Industry conversion rates, CPCs, cost per conversion benchmarks used in the industry table.
- Statista Digital Advertising Statistics — 2025–2026. Global CPC trend data and mobile paid search traffic share (67%+ mobile figure).
- HubSpot State of Marketing Report — 2025. PPC channel ROI performance and multi-touch attribution trend data.
- Search Engine Land — AI-Era PPC Report, January 2026. Performance Max adoption rates, Smart Bidding outperformance claim (82% of accounts).
- Google Ads Blog — 2025. Broad Match + Smart Bidding performance study (70% outperformance vs. exact match). Quality Score CPC impact data.
- Google Ads Help Center — Enhanced Conversions documentation, Data-Driven Attribution model technical specifications, conversion value rules.
💰 Ready to Calculate Your PPC ROI?
Apply the PPC ROI formula instantly with our free calculator — get Google Ads ROI, net profit, ROAS calculation, cost per conversion, and 2026 industry benchmarks. No sign-up required.
📈 Open Free PPC ROI Calculator →